Visualize, understand and improve your code
MPT’s product Blue Cheetah brings together the ability to visualize, analyze and improve your code by automatically optimizing it for multicore environments
Software is infiltrating everything, and increasingly determines the economics of business. It will be impossible to address development demand without large scale re-use and automation.
C code is everywhere enabling the foundation for much of the technology powering civilization as we know it.
Tools that change the way C code is created, managed, and deployed – such as MPT’s – are horizontally applicable to every industry on Earth. Modern society literally operates on C.
The C programming language is even the basis of most other languages. MPT began by proving its parallelization technology on C, but that’s not where it ends, additional languages are in process.
MPT has a nationally-acclaimed history of developing advanced parallel processing technologies. We have been awarded 32 patents on our innovative parallel processing methods. Blue Cheetah incorporates these methods and can automatically parallelize code in seconds at the click of mouse.
Workflow
Bringing your C code into Blue Cheetah is easy with our automated code capture
Static Extraction creates a navigable map of your code, which includes a Control Flow Graph, Call Graph and our extended battery of code quality metrics. Customers usually use static extraction first to add or modify functionality, then after changes have been verified, they utilize dynamic extraction.
Dynamic Extraction creates additional views into the code namely, Design View, Decomposition and Components View. It is here that parallelization sets are revealed. Now, the developer is able to review the sets manually, or choose to have Blue Cheetah automatically parallelize the code based on the profiling performance of each set. The code is now optimized to run on multi-core machines.
Static Analyzer
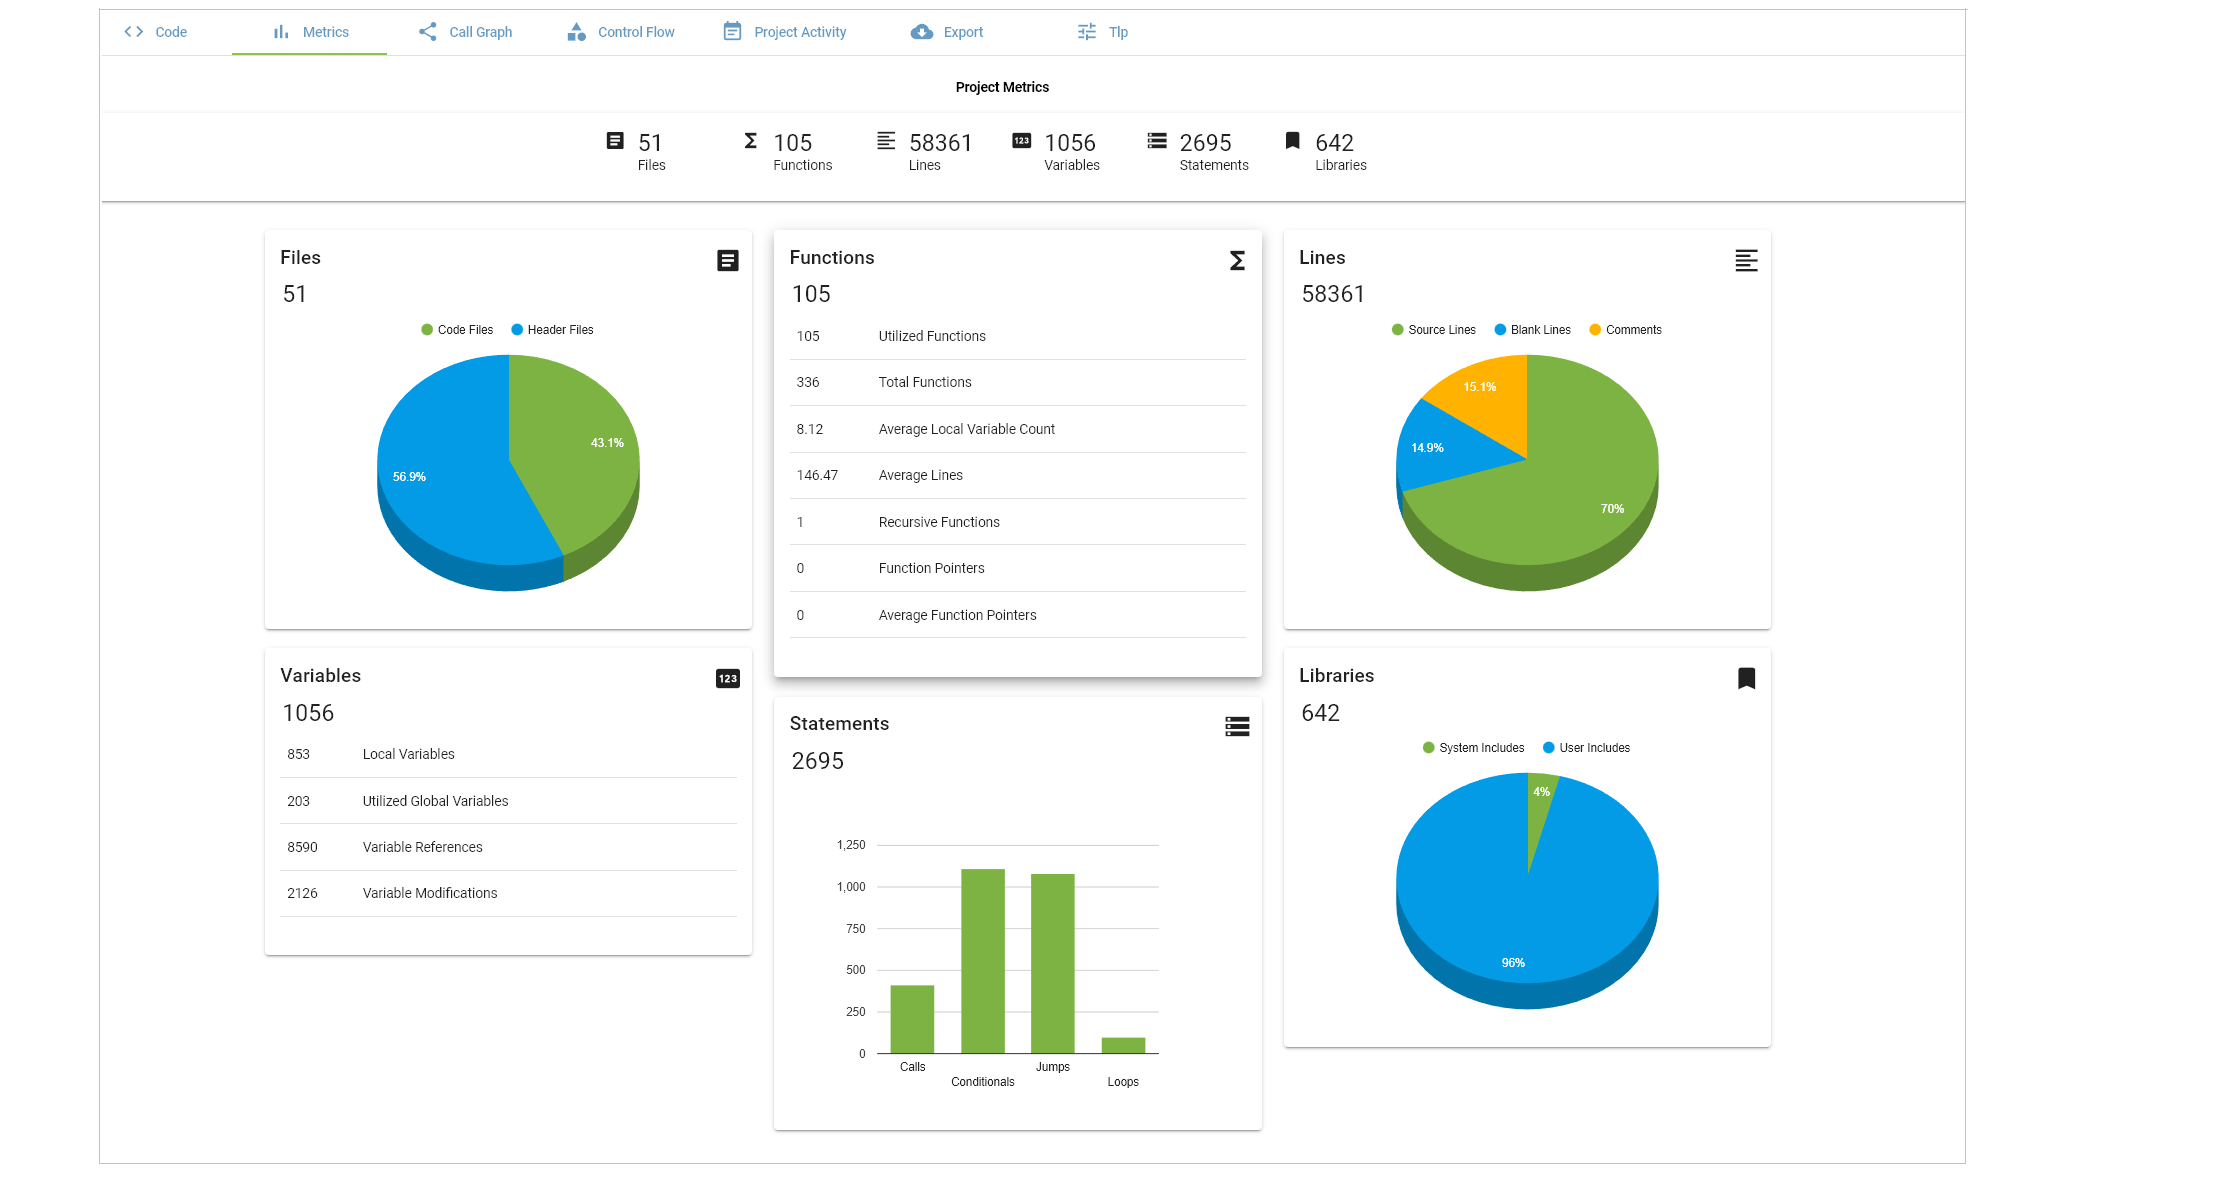
Metrics
Our extended insights into your code will reveal: the number of lines of code; files; functions; variables; and statements. Soon to come, we will be including cyclomatic complexity, loops, recursions and open ended functions.
Source Code Map
The Source Code Map is an automatically produced graphic layout or “map key” to the software code and is integrated with each of Blue Cheetah’s graphs. It is useful for navigation and inspection of the original code or “source of truth”.
Control Flow
Reveals the call structures within each function
Call Graph
Reveals the sequence of functions being called within a code
Dynamic Analyzer
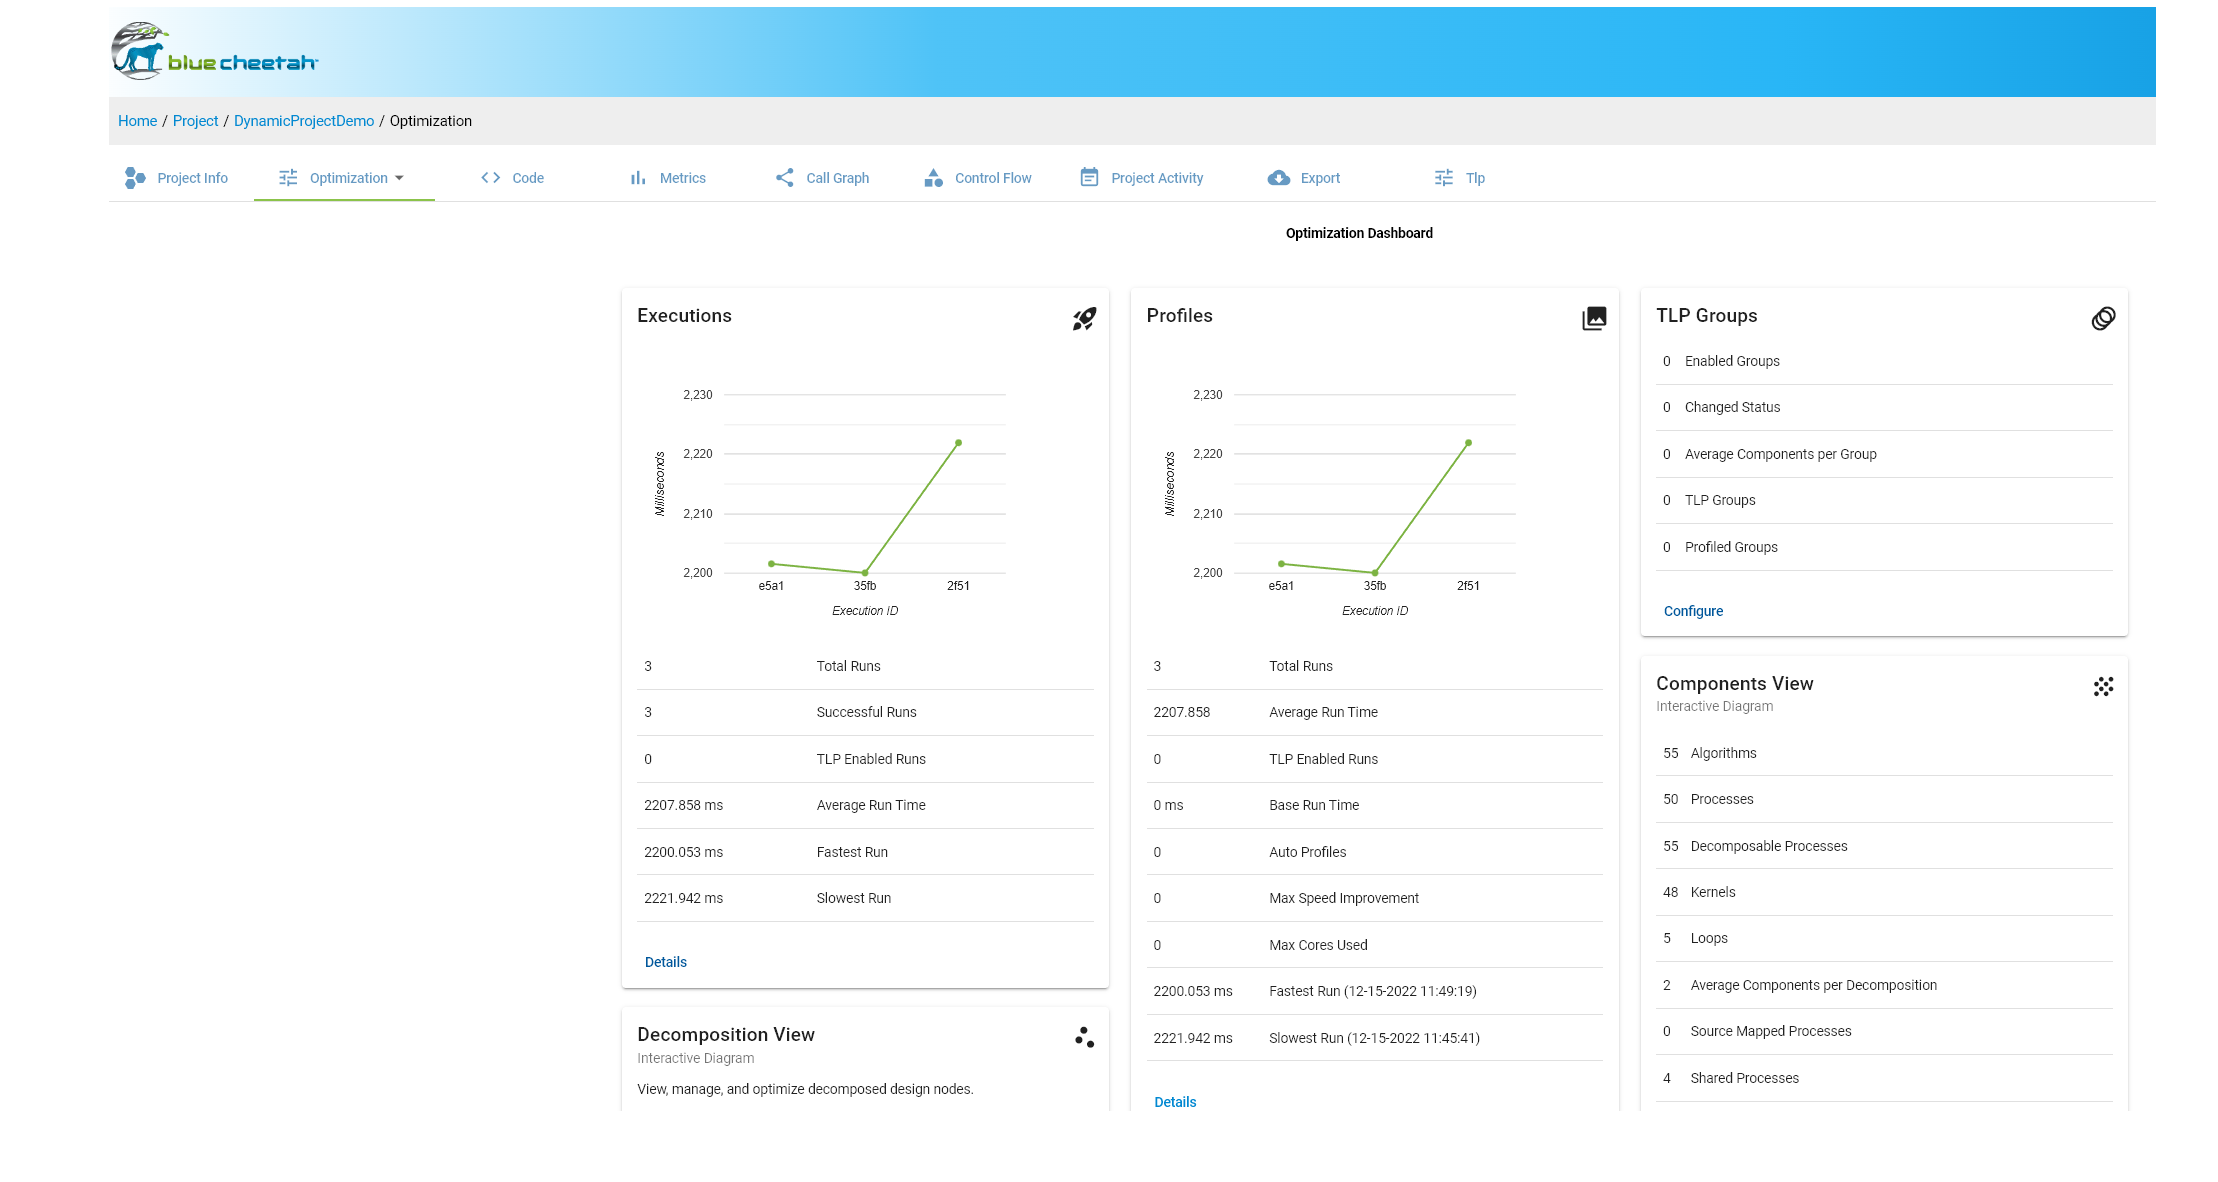
Component View
Using the big picture to find all implications for data flows and opportunities for parallelization. Allows filtering of kernels, algorithms and data flows. Clicking a node reveals the source code and navigation to other actions
Design View
Shows all the algorithms and assists the developer with navigation and collaborative design
Choose the license that's right for you
Dynamic Analyzer
-
Static Analyzer
-
C Code Only
-
Up to 10,000 LOC
-
Dynamic Analyzer
-
Automatic Task Level Parallelization
Enterprise License
-
Static Analyzer
-
C Code Only
-
Up to 30,000 LOC
-
Dynamic Analyzer
-
Automatic Task Level Parallelization
-
Up to 10 Users